High Resolution Spectroscopy
Our group is involved in high-resolution molecular spectroscopy. We pay particular attention to high-accuracy measurements of spectral line shapes, line centers and intensities in the visible and near-infrared region using cavity-enhanced methods with very accurate frequency axis and negligibly narrow instrumental function. These methods are particularly useful for measurements of weak transitions, important in atmospheric research and for trace gases detection. The frequency-stabilized cavity ring-down spectroscopy (FS-CRDS) is used and continuously improved in KL-FAMO since 2009. Recently two alternative cavity-enhanced methods, based on absorption and dispersion measurement in the frequency domain are developed. These are the cavity mode width spectroscopy (CMWS) and one-dimensional cavity mode-dispersion spectroscopy (1D-CMDS), respectively.
In parallel to the experimental research we develop spectral line-shape theory as well as advanced line shape models going beyond the Voigt profile to achieve sub-percent accuracy of molecular line parameters. Ab initio profiles enable reproduction of experimental data with signal-to-noise ratio of even 105. On the other hand, semi-classical line-shape models provide a combination of simplicity and high accuracy required in modern applications, such as atmospheric research, green-house gases monitoring, new-generation spectroscopic databases and many metrological applications.
Since its introduction in 1988 [1] cavity ring-down spectroscopy (CRDS) has proved its applicability in trace gas detection and precise measurements of weak absorption spectra. In CRDS experiments the resonant optical cavity filled with a light-absorbing gas is pumped up by the laser. The absorption spectrum can be determined by measuring the wavelength dependence of time constant of the decay of the light transmitted through one of the optical cavity mirrors. In early realizations of CRDS pulsed lasers were used [2]. However, the wide bandwidth of the pulsed lasers and the relatively low repetition rates resulted in limited data acquisition rate and low signal-to-noise ratio of the acquired. To overcome these limitations, in the 1990s single-mode continuous wave (cw) lasers were introduced in ring-down experiments [3] and are now commonly used. In cw-CRDS spectrometers the light decay is a result of rapid switching off the laser beam, for example by an acousto-optic modulator (AOM).
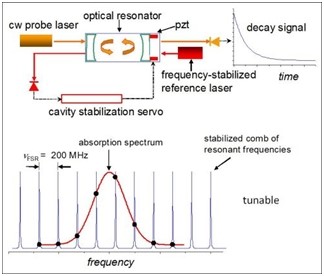
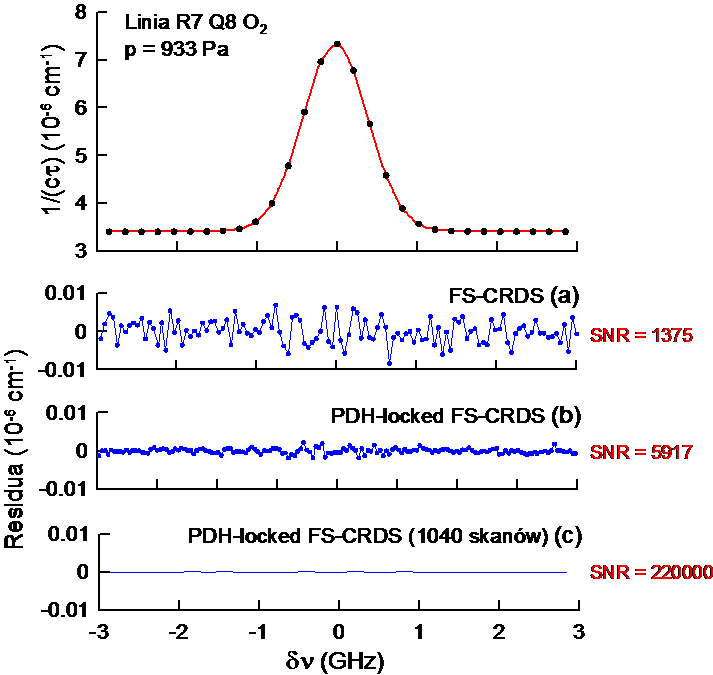
W odróżnieniu od technik CRDS i CMWS, metoda CMDS jest techniką dyspersyjną, a jej największą zaletą jest fakt, że całkowicie bazuje ona na pomiarze tylko jednej wielkości fizycznej – częstości. Dyspersyjne przesunięcie modów wnęki wynika z przesunięcia fazy promieniowania laserowego, w obrębie profilu absorpcyjnego, które prowadzi do odmiennych warunków rezonansowych dla fal stojących propagujących się we wnęce. Profile dyspersyjne jakie aktualnie mierzymy są profilami różnicowymi, otrzymywanymi jako różnica częstości między kolejnymi modami TEM00 wnęki. Na Rys. 14 przedstawione zostało po raz pierwszy na świecie porównanie kształtu linii widmowej zarejestrowanej jednocześnie trzema różnymi technikami. Zmierzone kształty linii widmowej CO zanalizowane zostały przy pomocy standardowego profilu Voigta (VP) i bardziej zaawansowanego profilu SDNGP, uwzględniającego ponadto zwężenie Dickego i efekty zależne od prędkości absorbera. Our group is developing experimental technique of the FS-CRDS [4, 5]. In this approach the accuracy of the frequency axis is assured by active stabilization of the cavity length using the frequency-stabilized reference laser. This setup was used for weak oxygen B-band (687 nm) line-shapes measurements at a low pressure range [6]. Our results revealed systematically different line intensities from data commonly used in the atmospheric research. Moreover, we demonstrated importance of the subtle line shape effects, such as Dicke-narrowing and speed dependence of collisional broadening on the line width and line intensity determined from the fits of model profiles. The Pound-Drever-Hall (PDH) method of locking the laser to the high-finesse ring-down cavity, used in improved version of the experimental setup [7], leads to significant narrowing of the laser line width. This method greatly improves spectrum signal-to-noise ratio and increases ring-down signal acquisition rate by three orders of magnitude. It allows to obtain the line-shape parameters with sub-percent-level uncertainties. Therefore it makes our spectrometer an ideal tool for investigations that require high sensitivity and high spectral resolution, e.g. spectroscopic determination of the Boltzmann constant that require very precise measurements combined with careful line shape analysis. Our measurements provided more accurate data for spectroscopic databases such as HITRAN. Our PDH error signal offset correction procedure [8] improved stability of the experimental setup and enabled long-term measurements that resulted in spectrum signal-to-noise ratio equal to 220000 [9]. This was the highest value obtained in absorption spectroscopy. The frequency axis was improved by measurement of the actual frequency of the probe laser by optical frequency comb [10]. The absolute line positions of several oxygen B-band lines were determined with sub-MHz uncertainty what is improvement by over two orders of magnitude compared to previously available data [11]. W odróżnieniu od technik CRDS i CMWS, metoda CMDS jest techniką dyspersyjną, a jej największą zaletą jest fakt, że całkowicie bazuje ona na pomiarze tylko jednej wielkości fizycznej – częstości. Dyspersyjne przesunięcie modów wnęki wynika z przesunięcia fazy promieniowania laserowego, w obrębie profilu absorpcyjnego, które prowadzi do odmiennych warunków rezonansowych dla fal stojących propagujących się we wnęce. Profile dyspersyjne jakie aktualnie mierzymy są profilami różnicowymi, otrzymywanymi jako różnica częstości między kolejnymi modami TEM00 wnęki. Na Rys. 14 przedstawione zostało po raz pierwszy na świecie porównanie kształtu linii widmowej zarejestrowanej jednocześnie trzema różnymi technikami. Zmierzone kształty linii widmowej CO zanalizowane zostały przy pomocy standardowego profilu Voigta (VP) i bardziej zaawansowanego profilu SDNGP, uwzględniającego ponadto zwężenie Dickego i efekty zależne od prędkości absorbera.
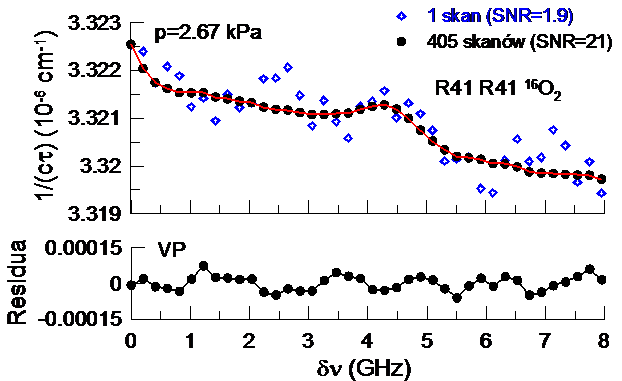
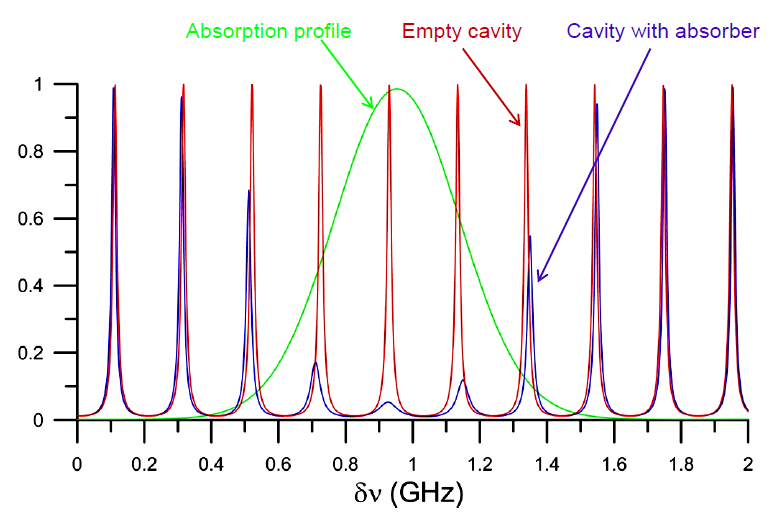
Our second setup, infrared PDH-locked FS-CRDS system, was built for investigation of carbon monoxide spectra at 1.57 μm [12]. This spectrometer was later modified to enable simultaneous measurements of gas sample with three cavity-enhanced methods: FS-CRDS, CMWS [13] and 1D-CMDS [14]. CMWS is based on determination of gas absorption coefficient from the spectral width of the optical resonator mode. This new method is complementary to the CRDS and may lead to higher precision of measurement at high absorption conditions. 1D-CMDS is entirely frequency based, i.e. both axes of the spectrum is determined from the frequency measurements. Measurement of full complex refractive index – absorption and dispersion simultaneously, allows to detect potential systematic instrumental effects on spectra with great accuracy. This spectrometer was recently used to demonstrate the first molecular spectrum with both axes directly referenced to the primary frequency standard [15].
References:
[1] A. O’Keefe, D. A. G. Deacon, Rev. Sci. Instrum. 59, 2544 (1988).
[2] A. O’Keefe, J. J. Scherer, A. L. Cooksy, R. Sheeks, J. Heath, R. J. Saykally, Chem. Phys. Lett. 172, 214 (1990).
[3] D. Romanini, A. A. Kachanov, N. Sadeghi, F. Stoeckel, Chem. Phys. Lett. 264, 316 (1997).
[4] J. T. Hodges, H. P. Layer, W. M. Miller, G. E. Scace, Rev. Sci. Instrum. 75, 849 (2004).
[5] J. T. Hodges, R. Ciuryło, Rev. Sci. Instrum. 76, 023112 (2005).
[6] D. Lisak, P. Masłowski, A. Cygan, K. Bielska, S. Wójtewicz, M. Piwiński, J. T. Hodges, R. S. Trawiński, R. Ciuryło, Phys. Rev. A 81, 042504(2010).
[7] A. Cygan, D. Lisak, P. Masłowski, K. Bielska, S. Wójtewicz, J. Domysławska, H. Abe,J. T. Hodges, R. S.Trawiński, R. Ciuryło, Rev.Sci. Instrum. 82, 063107 (2011).
[8] A. Cygan, D. Lisak, S. Wójtewicz, J. Domysławska, R. Trawiński, R. Ciuryło, Meas. Sci. Technol. 22, 115303 (2011).
[9] A. Cygan, D. Lisak, S. Wójtewicz, J. Domysławska, J. T. Hodges, R. Trawiński, R. Ciuryło, Phys. Rev. A. 85, 022508 (2012).
[10] J. Domysławska, S. Wójtewicz, D. Lisak, A. Cygan, F. Ozimek, K. Stec, Cz. Radzewicz, R. Trawiński, R. Ciuryło, J. Chem. Phys. 136, 024201 (2012).
[11] J. Domysławska, S. Wójtewicz, P. Masłowski, A. Cygan, K. Bielska, R. S. Trawiński, R. Ciuryło, D. Lisak, J. Quant. Spectrosc. Radiat. T. 169, 111 (2016).
[12] S. Wójtewicz, K. Stec, P. Masłowski, A. Cygan, D. Lisak, R. Trawiński, R. Ciuryło, J. Quant. Spectrosc. Radiat. Transf. 130, 191 (2013).
[13] A. Cygan, D. Lisak, P. Morzyński, M. Bober, M. Zawada, E. Pazderski, R. Ciuryło, Opt. Express 21, 29744 (2013).
[14] A. Cygan, P. Wcisło, S. Wójtewicz, P. Masłowski, J. T. Hodges, R. Ciuryło, D. Lisak, Opt. Express 23, 14472 (2015).
[15] A. Cygan, S. Wójtewicz, G. Kowzan, M. Zaborowski, P. Wcisło, J. Nawrocki, P. Krehlik, Ł. Śliwczyński, M. Lipiński, P. Masłowski, R. Ciuryło, D. Lisak, J. Chem. Phys. 144, 214202 (2016)